Please note, this blog was first published in January 2022. Some information relating to KS4 was updated in April 2022. For an updated blog about the KS2 progress calculation methodology 2022, see here (September 2022).
As schools start to prepare for a full return to statutory assessment as we knew it pre-Covid, a frequently asked question (amongst both primary and secondary colleagues) is ‘How will the progress measures be calculated this year?’
At Key Stage 4, the current cohort of Year 11 students will be the first whose Progress 8 scores will be based on prior attainment measures calculated from the ‘new’ (post-levels) Key Stage 2 data. (Last year’s Year 11 would have been the first such cohort, but progress measures were not calculated last year.)
And at Key Stage 2, the current Year 6 is the first of the cohorts whose Key Stage 1 assessments were made using the ‘Teacher Assessment Framework’ (rather than the previous system of National Curriculum levels) to sit KS2 tests. (The summer 2020 Year 6 cohort would have been the first, but SATs did not take place in that year, or indeed last summer.)
Therefore, at both of these Key Stages, the progress model will necessarily be different to that used in previous years. But how much do we know about the new models that will be used?
Whilst we can make some assumptions and educated guesses about how the DfE might calculate progress, the truth is that nobody can say for certain. And the reason is that the DfE’s statisticians are going to want to see the actual data (i.e. the results of 2022 assessments) in front of them, so that they can explore which methodological approach has the greatest correlation, before making a final decision. Generally speaking, progress methodology is established in this way – find the approach that gives the best correlation between the input measures and the output measures – and build from there.
Let’s explore each Key Stage.
Key Stage 4: ‘Progress 8’
In previous years, establishing students’ prior attainment involved taking their raw scores in KS2 tests and converting these into a ‘fine level’, e.g. 4.75 would indicate a student whose test score was exactly three quarters of the way along the range of marks allocated to Level 4.
However, since 2016, the system for reporting KS2 SATs results has involved converting the raw test scores into a continuous scale of ‘scaled scores’. These scaled scores are not as precise as fine levels were – each score represents a range of raw test marks rather than just a single mark (e.g. in the 2016 KS2 maths test, a scaled score of 101 was allocated to the mark range 65-69 out of 110). The raw scores for individual pupils can be downloaded from the DfE’s (soon to be decommissioned/replaced) key to success website.
Update (April 2022) – at KS4, the DfE have confirmed that, for the calculation of a pupil’s prior attainment, they plan to use the average of their scaled score in KS2 reading and scaled score in KS2 maths. However, the precise nature of the Progress 8 model, such as how the pupils are split into different prior attainment groups, will be released in the autumn.
NB the recent guidance does confirm how pupils will be split into the 3 broad prior attainment categories of ‘High’, ‘Middle’ and ‘Low’, although it should be noted that these broad categories do not form the basis of how Progress 8 is calculated. They are merely about slicing the cohort into 3 broad groups for data analysis purposes. The guidance confirms that the Low PA group will be pupils whose average scaled score is below 100, and High PA group will be those whose average scaled score is 110 or higher. (The Middle PA group are those in between – scores from 100 upwards but less than 110.) This does represent a significant change to the distribution of students compared to the 2019 model (based on ‘fine levels’) – as shown in this table:
|
Low |
Middle |
High |
|
|
2018/19 |
12% |
45% |
43% |
|
2020/21 |
33% |
52% |
15% |
National Distribution of KS4 Students into Low, Middle and High Prior Attainment groups
Data source: https://explore-education-statistics.service.gov.uk/find-statistics/key-stage-4-performance-revised/2020-21
For children who did not take the KS2 tests because they were working at too low a standard, teacher assessments will be used and converted into nominal scores. The pre-key stage standard system used back in 2016 and 2017, which has since changed, used categories PKG (79 points), PKE (76 points), PKF (73 points) and BLW (70 points). Back in 2016, teacher assessments were submitted for all children, including those working within the standard of the tests, so again it’s possible that these could be used in calculating prior attainment for any children who were absent from tests. (WTS=91 points, EXS=103 points, GDS=113 points.)
NB whatever approach is decided upon for calculating prior attainment measures for this cohort, the chances are the approach is going to have to change a further few times over the next few years, as the DfE made several adjustments to KS2 assessment over the years 2016-2019: inclusion of P-level scores, changes to the Pre-Key Stage Standards, removal of the requirement to submit a teacher assessment in reading and maths for children working at the standard of the test etc.
The above is all about how prior attainment (the ‘input measure’) is calculated. As for the calculation of the ‘output measure’ (i.e. results in KS4 exams), the latest guidance confirms that this will follow virtually the same approach as the last time Progress 8 was calculated (2019). One key difference is that results from early entries (taken in 2019 or 2020) will not be included in the Attainment 8 or Progress 8 scores.
And, as is always the case in Progress 8 measures, the ‘expected value’ of the output – the P8 score of zero – will be based on the national average Attainment 8 score for students with the same prior attainment score in that year. The progress measure is always norm-referenced in this way – it demonstrates whether the students in that school made more or less progress than the average amount of progress in that particular year, but does not seek to make comparisons with progress made in other years.
Key Stage 2 Progress Scores
The first thing to say is that, although the DfE has said that KS2 data will not be published in the public domain for Summer 2022 results, they will “still produce the normal suite of KS2 accountability measures at school level and share these securely with primary schools, academy trusts, local authorities and Ofsted for school improvement purposes and to help identify schools most in need of support”. In other words, the data will be reported in Analyse School Performance and the IDSR. The phrase ‘normal suite of KS2 accountability measures’ implies that progress scores will be calculated.
Summer 2020 would have been when we found out what the new progress model would look like, as this was the cohort that completed KS1 in 2016, the first ‘non-levels’ cohort. But of course SATs didn’t happen in 2020 - nor did they happen in 2021 – so we are still guessing about how this model might work.
What we can say with certainty though is that the DfE only have teacher assessment data to go on at KS1. Although Year 2 teachers are required to administer KS1 tests, the scores from these are not collected.
So, as in the previous model, it seems reasonable to assume that point scores will be assigned to teacher assessment categories. It is also quite conceivable that the approach will once more be to combine pupils’ teacher assessments in reading, writing and maths to produce one prior attainment measure, which is used as the basis for calculating progress in each KS2 subject area. And the way those three measures are combined might, once again, be a weighted average, giving maths equal weight to the two elements of English. But, it must be emphasised, this is mere supposition at this point.
However the prior attainment measure is arrived at, the calculation of KS2 progress scores will be (as always) based upon determining the national average outcomes in KS2 SATs for each and every prior attainment score. Children’s progress scores are then the difference between their scaled score outcome and the national average scaled score outcome for children with the same prior attainment.
As with Progress 8 at KS4, it is a norm-referenced system. There must, by definition, be some schools that end up with positive progress scores and some with negative. It is all about showing how well your students progressed compared to everybody else.
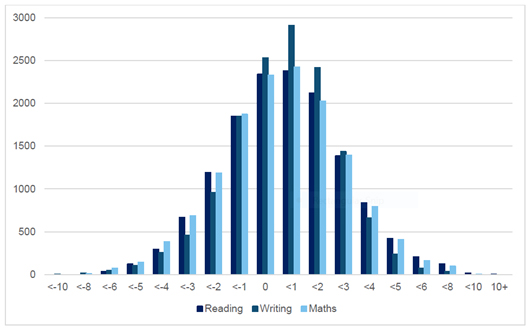
One of the DfE’s aims is to be able to use 2022 results to explore the impact that Covid has had on educational standards. It is only through attainment measures that this can be established, not through progress scores. The progress scores will always, by nature of how they are produced, reveal a set of data across schools that forms a ‘Normal distribution’. There will be broadly the same number of schools with progress described as ‘average’, ‘above average’ and ‘below average’ as in any other year. This image shows what the range of KS2 progress scores looked like in 2019:
Can we use prior attainment data to set targets for this summer?
Given that we a) do not know how prior attainment will be calculated, and b) have no idea at all how these prior attainment scores will correlate to key stage outcomes this summer, I would say it is impossible for schools to, in-house, attempt to work out targets for individual students (and futile to try).
There are, however, tools available which could give us pretty good indications of what learners might need to achieve if a school is to end up with positive value added. The Fischer Family Trust, for example, which has access to the national dataset and has many years of experience working with the statistical models employed by the DfE, are able to produce estimates of what outcomes might be expected of learners if they make progress in line with the national average, or at the 20th or 5th percentiles. They can do this by accurately calculating each student’s position within the national rankings at the previous key stage, and then matching this to an assumed distribution of scores at the next key stage.
How robust these estimates will turn out to be this year remains to be seen, but over time as more national data is accumulated, one would expect the model to become more and more reliable.
In the meantime, it’s worth remembering this: from the learner’s point of view, attainment is all that matters. Whether it be a qualification, as is the case in Key Stages 4 and 5, or an indication of where you are at in your learning journey at a key point of transition, as is the case with KS2, attainment is key. Students never find out what their progress scores were. Those are only used for school accountability.
The main message, therefore, has to be to focus on securing the necessary learning between now and the statutory assessment window. If we can give learners the best possible chances of attaining well, despite whatever learning gaps may have opened up over the last 20 months, then the progress scores will take care of themselves.
Ben Fuller


